Cone of uncertainty for Agile projects
As the title might betray, this article is about the uncertainty of estimations within software projects.
We all know that estimating software effort is one of the hardest things to do. In the beginning of a project we have very little information to make accurate estimations. Sadly enough most of the time this is the moment where we have to come up with some estimation for the total project. To make it worse this initial estimation is often used to claim budget and resources.
How can we tell our managment or customer that to make more accurate estimations we need more information? Some people may have seen a well known graph which is called the “Cone of uncertainty”. This graph was initially mentioned by Barry Boehm (Boehm, 1981) and later called the Cone of Uncertainty by Steve Mc Connell (Mc Connell, 1997). This graph is now widely used by all who have something to do with software management and estimations.
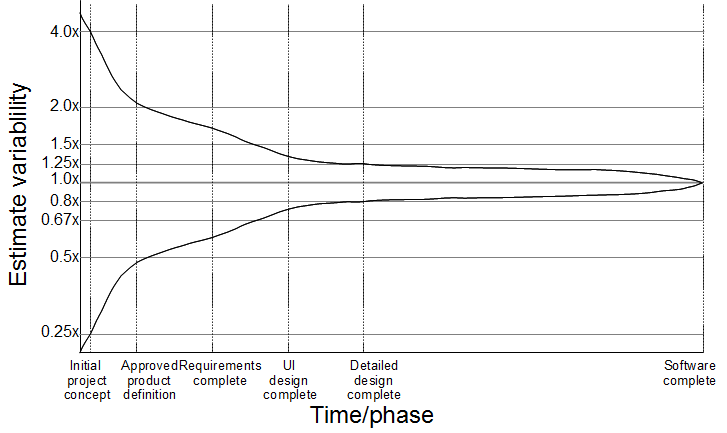
Diagram 1: Cone of Uncertainty for waterfall projects.
Diagram 1 shows the graph as mentioned in the book “Software Estimation: Demystifying the Black Art (Best Practices (Microsoft))” by Steve McConnell. The horizontal axis shows different phases the software development project is in, while the vertical axis shows the variability of estimations of the total effort (budget/cost/resources). Note that the original diagram used a logaritmic vertical scale where for the sake of simplicity I replaced the scale by a linear one. The diagram clearly shows that estimations at the start of the project can be off as much as 400%. After a product definition is created and approved, the variance has dropped to 200% (plus or minus). The further a project has made progress the better estimations will be. At the end of the project there is no variation in estimation anymore. At that point the project is finished and we know exactly how much effort it took to build.
So can we use this exact graph to explain the variation in estimations for Agile projects? As Jeff Sutherland (one of the founders of Scrum) pointed out in one of the discussions on the Linked In Certified ScrumMasters group, this diagram is created for old school waterfall development methods. It does not apply to Agile methods.
While I was researching this topic for my book on Scrum it started me thinking about how the diagram would look for an Agile project. While the end result might not be very unexpected, I decided to write this article on it. Before I show you the graph I must emphasize that the data used is purely based on educated guesses. To my knowledge there is no empirical data (yet) to prove nor disprove the correctness of this graph.
Several articles and books are publiced on the subject of Agile estimations. Most of them agree that since Agile divides the project into small iterations, each iteration has it’s own set of features and uncertain estimations. Therefore each iteration goes through it’s own (small) Cone of Uncertainty. Is this Cone of Uncertainty for iterations exactly the same as the original Cone? No it is not.
I will use an example project to clarify my assumptions. For this example I will use Scrum as the choosen Agile method. Some might kill me for saying this but in Scrum we can discern some similar phases as the waterfall method. At some point in time someone decides to create a project (Initial project concept) and after that the Product Owner will, together with the customer, create a product vision artifact (Approved product definition). The Product Owner then creates an Initial product backlog which is a very simple version of a requirements set. It is only up till this phase that the comparison with waterfall and Scrum can be made. At this moment the Iterations will start and the Iteration Cone of Uncertainty will start it’s influence.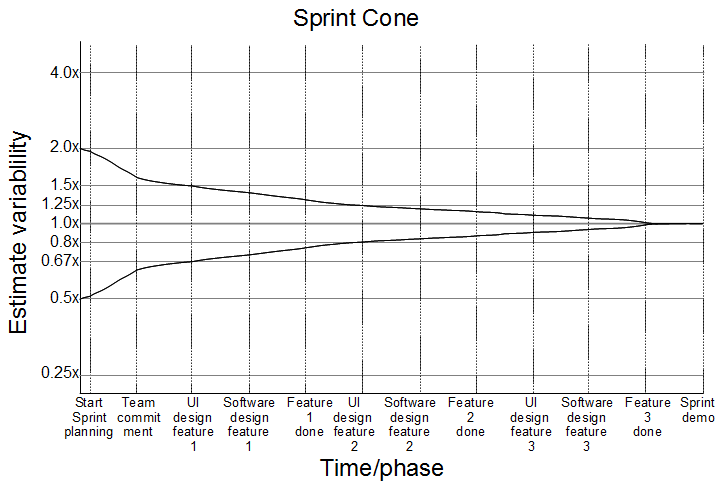 Diagram 2: Sprint Cone of Uncertainty
The Sprint Cone as I will call it from now on starts off with more information than a blanc project. After all, we already have a product vision and initial backlog. We might be able to estimate the features in the Sprint with an error of around 200%. Slightly worse than the original Cone after The “Requirements complete” phase since we haven’t done any thorough feature research yet. After the Sprint planning meeting, most of the features are known and the team commits to implementing these features in the coming Sprint. All features on the Sprint backlog will be designed and built within that Sprint. At the end of the Sprint the effort of all features is know exactly leaving no variation in estimation for those features. Then the next Sprint will start. The Sprint Cone will have a diagram similar to diagram 2. The exact form will depend on the number of features on the Sprint backlog.
As said each Sprint will go through it’s own small Cone of Uncertainty with only a small portion of all requirements. We can draw a Cone of Uncertainty for the total project. Diagram 3 shows this graph. The exact form and slope of the lines depend on the number of Sprints needed to implement the project.
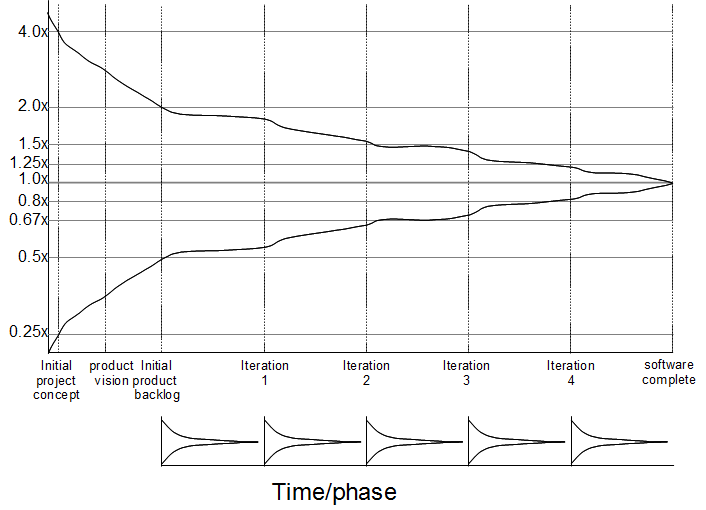
Diagram 3: Agile Cone of Uncertainty
To make things a bit more practical I have added an example project with the calculated estimations (and variations). In this example I use a project that has a total of 1000 effort units (which we only know after the project is finished). This effort will be build using 5 Sprints of 200 effort units each. After the first three initial phases the estimation uncertainty will be around 200%. This means the team will estimate the total project to be 2000 units maximum and 500 units minimum.
The first Sprint has 200 units of effort but those will be estimated to be between 400 and 50 units. Following the Sprint Cone, the estimations for the Sprint features will be more accurate during the Sprint. At the end of the Sprint we know that the effort has been 200 units. Then the next Sprint starts. We now have only 800 (uncertain) units left to build since we already have built 200 units of effort. As with the first Sprint, the estimations for this Sprint start off between 400 and 50 and will become more certain as the Sprint is on the go. This will continue until the whole project is finished and there is no uncertainty anymore.
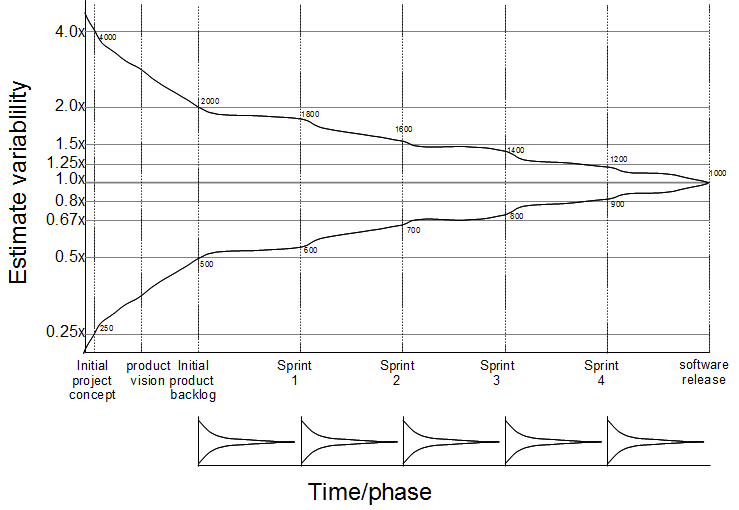
Diagram 4: Example project estimation uncertainty
In reality the Cone of Uncertainty will have a less simplyfied form. There are some Agile (and not Agile) elements that affect the Cone.
- In Scrum, the team regularly comes together for a backlog grooming meeting. In this meeting the top of the product backlog is explained and clarified by the Product Owner and the team will make estimations for each backlog item. These meetings will have the effect that during a Sprint the uncertainty of other features will be less.
- Due to the Agile manifesto rule to embrace changes, the Product Owner (or the customer) might be inclined to make more changes to functional requirements than in waterfall driven projects. This effect might increase the total uncertainty of the project.
- Is the Cone really simmetric? Due to the Planning Fallacy phenomenon people tend to underestimate needed effort. In my opinion the top margin of the cone will be lower as people often think it is less effort than in reality.
Conclusion
So now we know what a Cone of Uncertainty would look like in Agile projects, what do we do with this knowledge? To be honest: Not much. The Cone does have a different form than for waterfall projects but only slightly. The main pitfalls about estimating still exist. At the start of a project (waterfall or Agile) we don’t have enough information to make accurate estimations. Only when we are well underway we can see where the project is heading to and make better estimations.
We know that people are much better estimating relative sizes than absolute sizes. If your company has done a lot of similar projects you might be able to estimate the relative size of a project to other projects you have finished and make estimations that way. If the project is totally new and you are asked to estimate it, you are screwed. There is no way to accurately estimate a (large) project at the beginning.
If your managers tell you to make an estimation for a project, that is the moment you get your picture of the Cone of Uncertainty out of the drawer and tell them of the risks of estimation.